How do we surface sensitive, predictive data in a way that people can understand and trust?
ROLE:
LEAD PRODUCT DESIGNER
TIMELINE:
JUNE 2025 - AUG 2025
SKILLS:
RESEARCH, RAPID PROTOTYPING, DESIGN
ABOUT
Lattice sits at the center of performance, engagement, and HRIS data. If we could responsibly predict attrition, we could shift from reactive talent management to proactive intervention.
This initiative began as a Hackweek experiment: a small team built an internal model that predicted likelihood of attrition within 90 days.
CHALLENGE
The PoC generated excitement but it was raw. The question wasn’t “Can we build this?”
It was: Should we ship this — and if so, how do we do it responsibly?
For this project, I led the strategy to transform that experiment into a trusted, production-ready feature — now live with customers and expanding into Talent accounts integrating external HRIS data.

PROCESS
Where I started
Our initial direction was transparent and simple:
Show a precise numeric score (e.g., 76%)
Call it “Attrition risk”
Surface a broad set of contributing attrition and retention indicators
Display prominently at the employee profile level

Naming and Precision
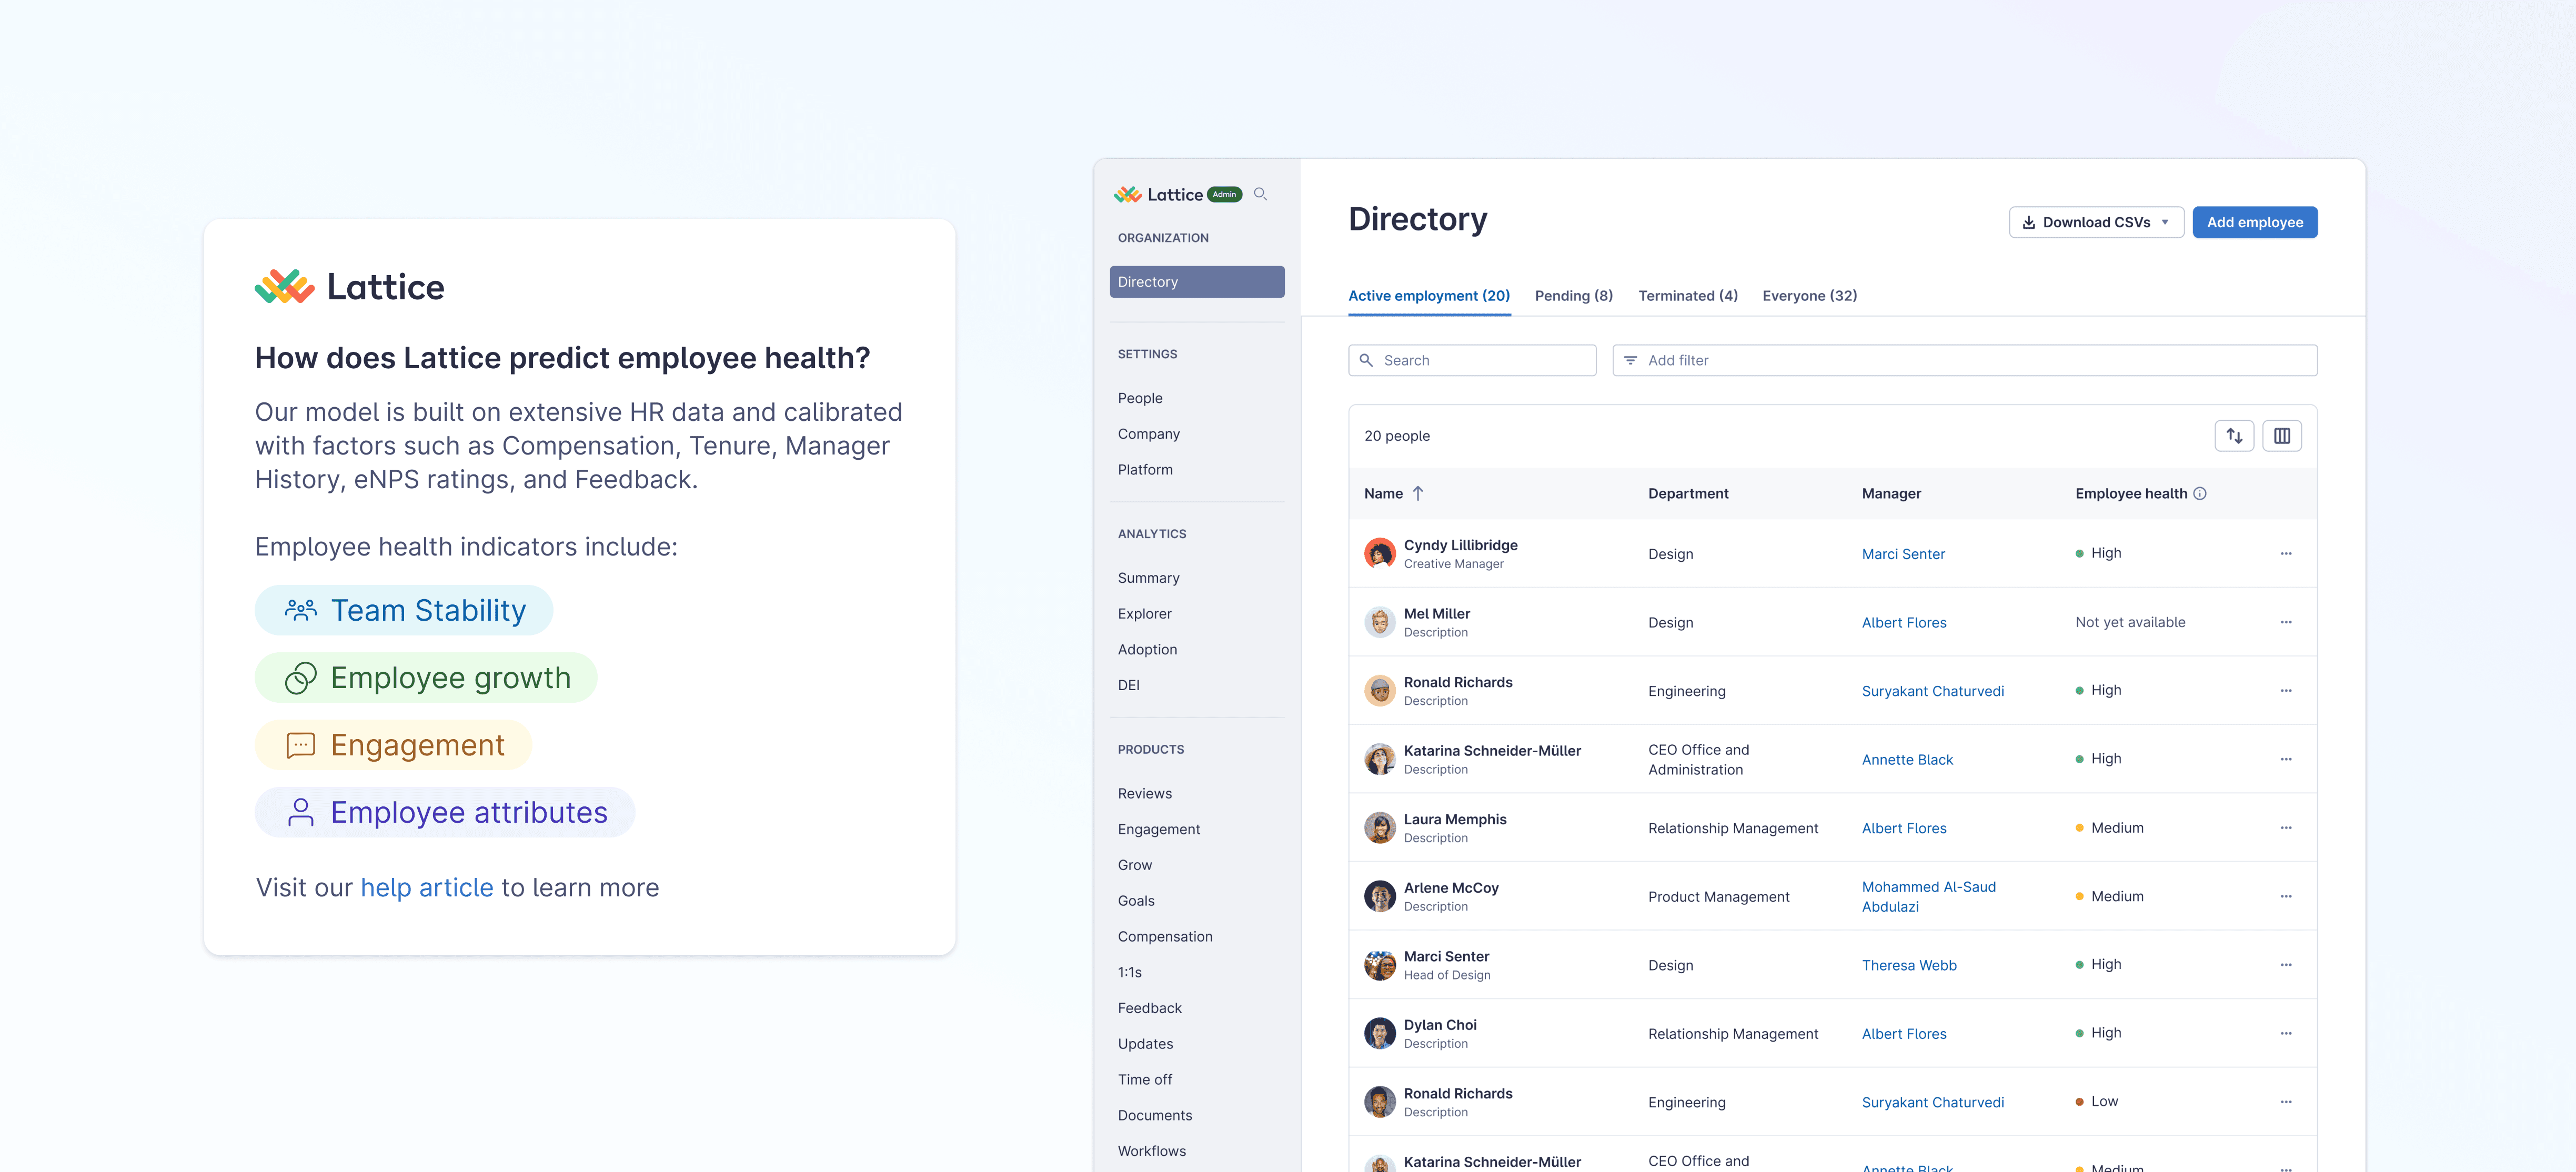
Numeric percentages implied a precise level of certainty. Participants reacted with skepticism and discomfort. We shifted to High / Medium / Low abstraction. This reframed the score as directional guidance rather than exact prediction.
We also shifted the naming from Attrition Risk which felt alarming to Employee Health.

Exhaustive Indicators → Curated Signals
The next iteration introduced structure. Instead of listing signals, I grouped them into risk themes like:
Team instability
Stagnant growth
Engagement
This reduced noise and improved scannability. Managers could understand why someone was high risk — not just that they were. It was a shift from exposing data to shaping understanding.

The Bigger Shift: From Individual alerts to organizational intelligence
Early thinking centered on employee profile visibility but we learned that admins were less concerned with single flags and more interested in patterns. The value was enabling leaders to understand where retention risk concentrates.
Instead of shipping attrition risk as a profile widget, we aligned with Analytics to productize it as a structured product field. This enabled filtering, breakdowns, custom reports, and more.

Tradeoffs
Precision vs Trust
We sacrificed numeric specificity and curated signals for trust.
Why: To preserve interpretability.
Urgency vs Psychological Safety
We reframed language for Psychological safety.
Why: To avoid labeling employees negatively.
Speed vs Governance
We adjusted direction based on research rather than shipping the hackweek output.
Why: To ship a more thoughtful solution.
Local Feature vs Platform Pattern
We embedded the score into analytics infrastructure.
Why: To ensure scalability and durability.
Impact
This work transformed: A hackweek project → Into a trusted predictive feature → Into a scalable intelligence layer.
It also established a repeatable pattern for introducing predictive intelligence and AI insights responsibly. The feature is now live with customers and expanding to Talent accounts integrating external HRIS data.